Combine location intelligence with advanced analytics and AI to find the optimal store locations
Download case study for the largest discount retailer in the Nordics

Identify prominent new locations
Store Network Optimizer showcases relevant nearby competitor presence as well as detailed population demographics within the estimated catchment area.
It generates credible sales forecasts for each map square. This information is to be used for evaluation site profitability calculations.
Generate detailed information basis for individual locations
Showcasing relevant location demographics, competitor presence and distance to nearest own stores
Locations' sales forecasts are broken down to category level

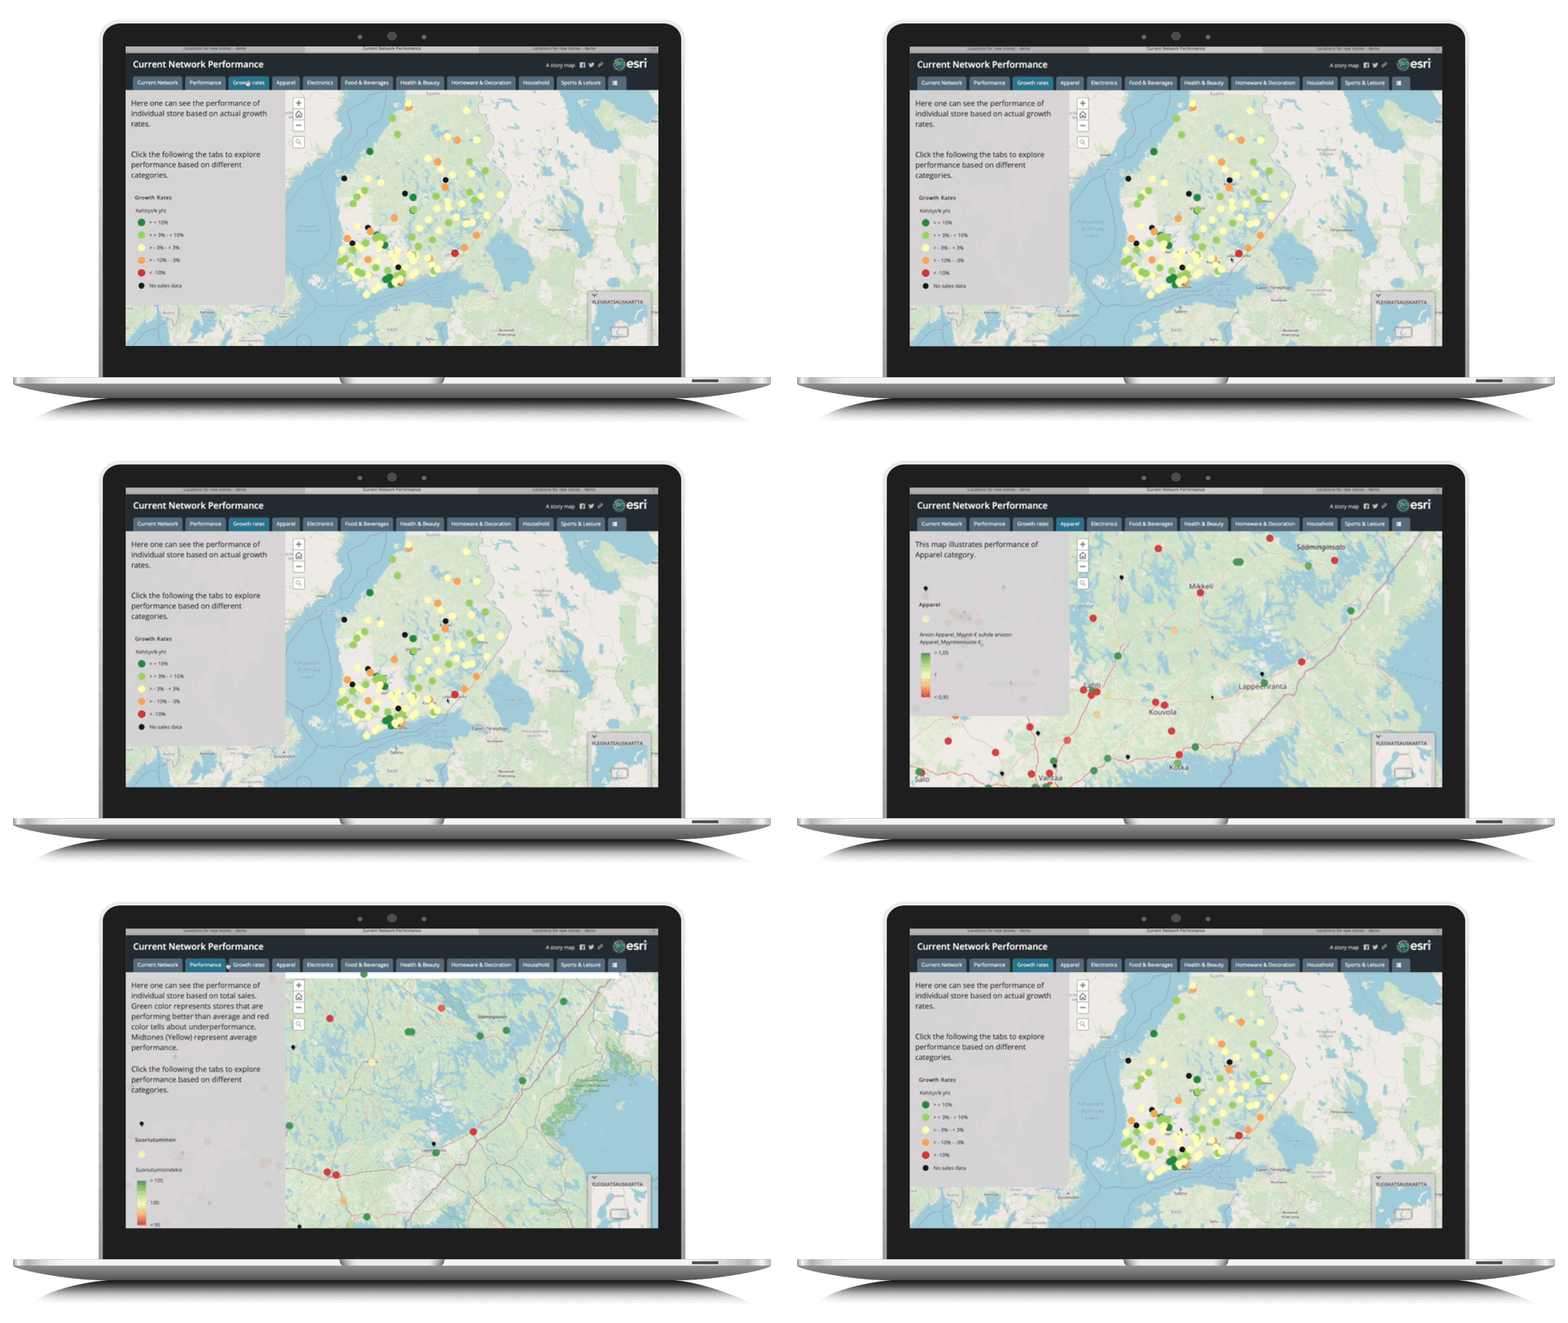
Enhance understanding of current store network performance and their drivers
Which stores are performing up to their full potential? Where and in which categories performance can be improved, and what demographic or competitor presence explain store performance variations?
Comparing budgeted sales to actual sales leaves one key question unanswered: what is the sales potential and how well is that met?
Current network performance analyses uses forecasted sales as the baseline which actual sales is compared with. Total sales forecast is broken down on a category level to indicate over- and underperforming categories giving actionable insights on category allocation – and performance enhancements.

"Together with Houston Analytics we were able to model our 2020 store location network. Our co-operation was very smooth and the knowledge we gained thanks to analytics will be very useful for IPO and everyday decision-making."
Jari Laine
Director, Business Development, Tokmanni Group Oyj
Download case study of the Nordics’ largest discount retailer
Frequently Asked Questions
What retailer questions Store Network Optimizer answers to?
Store Network Optimizer helps retailers to find:- potential for store network (maximum amount of stores a certain area can sustain, ideal structure of store network by different sizes/assortments and sensitivity analysis/cannibalization),
- prioritized locations (prioritized lists of most potential locations, description of most important demographics and estimates of cannibalization),
- most potential store size/concept for each location (estimation of the ideal store size by location, and estimation of the ideal store assortment by location), and
- detailed forecasts for each location (forecasts for store footfall, average purchase and margins, sales potentials for both existing store network and new store openings).
What data is needed for Store Network Optimizer?
Store Network Optimizer leverages data from different data sources. The data typically includes existing service/store network area and offering ( customer data ), customer database (CRM), offering data (products/service), historical sales data, and Grid database for a selected market.
Sign up for updates
©2014-2024 Houston Analytics. All rights reserved.


